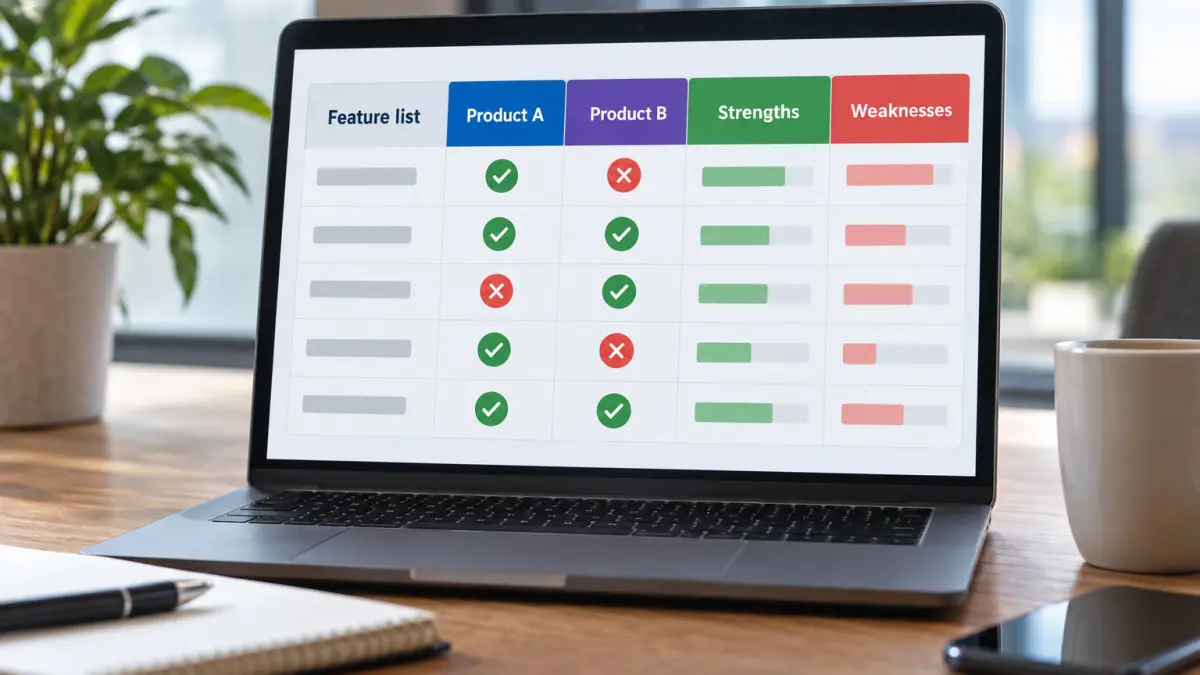

Competitive product feature analysis is essential for product managers aiming to understand market positioning and identify opportunities. This prompt helps you quickly generate AI-curated comparison charts that lay out features side-by-side, making it easy to spot strengths and gaps. Use it when evaluating direct competitors or benchmarking new products.
The AI-driven approach works well because it organizes complex data visually, reducing cognitive load and speeding decision-making. Color coding strengths and weaknesses adds immediate clarity, enabling teams to focus on areas needing improvement or differentiation.
To customize, specify the exact features or product categories you want to compare. You can also expand the prompt to include more than two products or add a scoring system for quantitative analysis. This flexibility ensures the output fits your unique research needs.
ROLE: You are a product manager or analyst.
OBJECTIVE: Generate a competitive product feature comparison chart.
CONTEXT: Compare features of two or more competing products to identify strengths and weaknesses.
REQUIREMENTS:
- Include a side-by-side feature list for each product
- Highlight strengths and weaknesses with color coding
- Use clear, concise labels such as "Feature list," "Product A," "Product B," "Strengths," and "Weaknesses"
- Ask up to 3 follow-up questions to clarify product names and key features before creating the chart
OUTPUT FORMAT:
- Visual comparison table with color-coded strengths and weaknesses
- Summary of key insights
QUALITY CHECK:
- Ensure accuracy of feature data
- Confirm visual clarity and easy readability