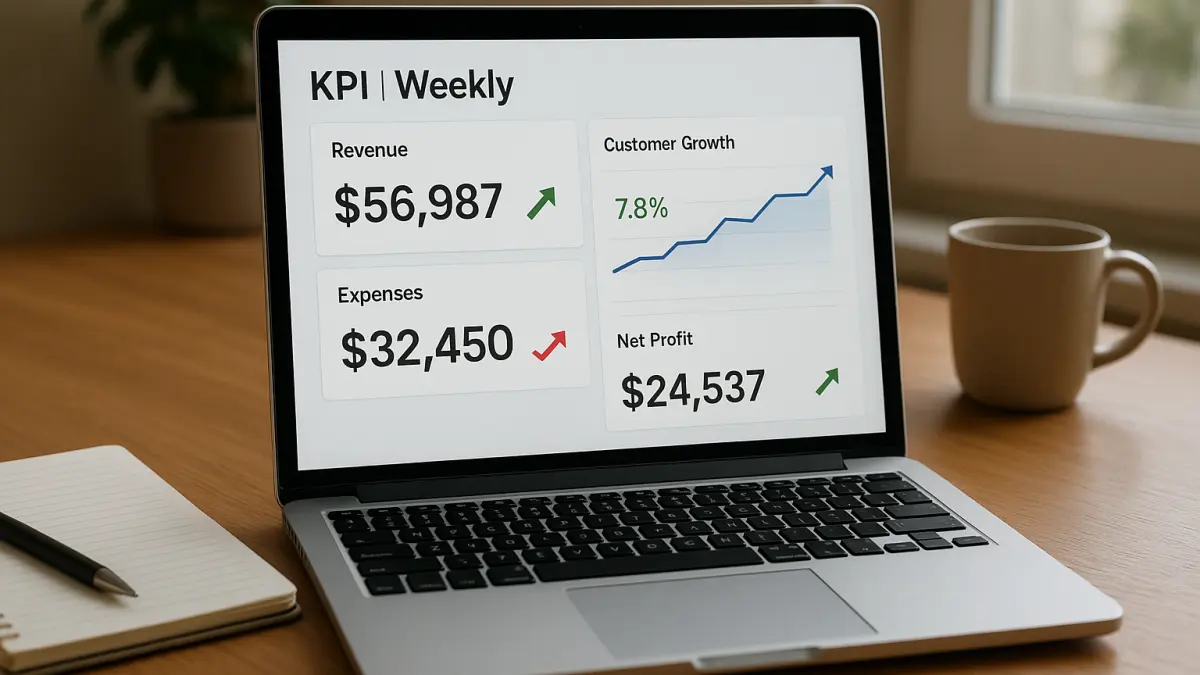

An AI-powered personalized weekly business KPI dashboard helps small business owners stay on top of their performance without drowning in data. By generating AI-curated summaries, this tool highlights key metrics, visualizes trends, and offers actionable insights tailored to your business needs.
Use this prompt when you want to automate the tracking of your most important KPIs and receive clear guidance on what the numbers mean each week. It works well because AI can analyze data patterns quickly and surface meaningful trends that might be missed otherwise.
To customize, start by defining which KPIs matter most to your business, sales, customer retention, cash flow, or others. The AI will then focus on those areas, making the dashboard both relevant and actionable. This approach saves time and empowers smarter decision-making.
ROLE: AI assistant
OBJECTIVE: Generate a personalized weekly business KPI dashboard summary
CONTEXT: Small business owners need to track key performance indicators efficiently
REQUIREMENTS:
- Ask up to 3 concise follow-up questions to tailor KPIs and business context
- Include AI-curated insights highlighting trends and actionable recommendations
- Visualize KPIs with trend arrows and graphs for clarity
OUTPUT FORMAT:
- Provide a clear dashboard summary with key metrics, trends, and insights
- Suggest next steps based on data patterns
QUALITY CHECK:
- Confirm relevance of KPIs to business type
- Ensure insights are practical and easy to understand